Back to the work

Case notes · Web app

Body Temperature

A fever tracker for the nights you are up every three hours with a sick child. Every temperature and every dose of paracetamol on one timeline, so you can see whether the fever is riding the medicine down or breaking through it.

Next.js · Neon Postgres · Vercel · Live, private to one family · Screenshots show sample data

Why it exists

A child with a fever is measured every few hours for days. Someone writes the numbers on a notes app, or on the back of a pharmacy receipt, or not at all. By the second night nobody can answer the questions that actually matter: is this coming down, when was the last dose, and did the last spike happen while the medicine was still supposed to be working.

Two parents also need the same log. One is holding the child and one is at the pharmacy, and a record that lives in one phone's browser storage is a record only one of them has. That is why this stopped being a local page and became an app with a database behind it.

What it does not do is give medical advice. It never says a dose is due, never says to go to hospital, never interprets. It records faithfully, shows the two records against each other, and leaves the judgment to the people qualified to make it.

The two questions at 3 a.m.

How hot is she right now, and how long since the last dose. Those are the only two things anyone wants at three in the morning, so they are the only two things at the top. The temperature carries its band in words, not just a colour, and the dose panel reports the interval and the count in the last 24 hours.

The dose panel is deliberately descriptive. It never says another dose is due, because a safe interval depends on age and weight, and an app that guesses at that is an app that hurts somebody. Underneath, the context nobody can hold in their head: the peak in the last 24 hours, the highest of the whole episode, and how many of the readings above 39 landed inside the window a dose was supposed to be covering.
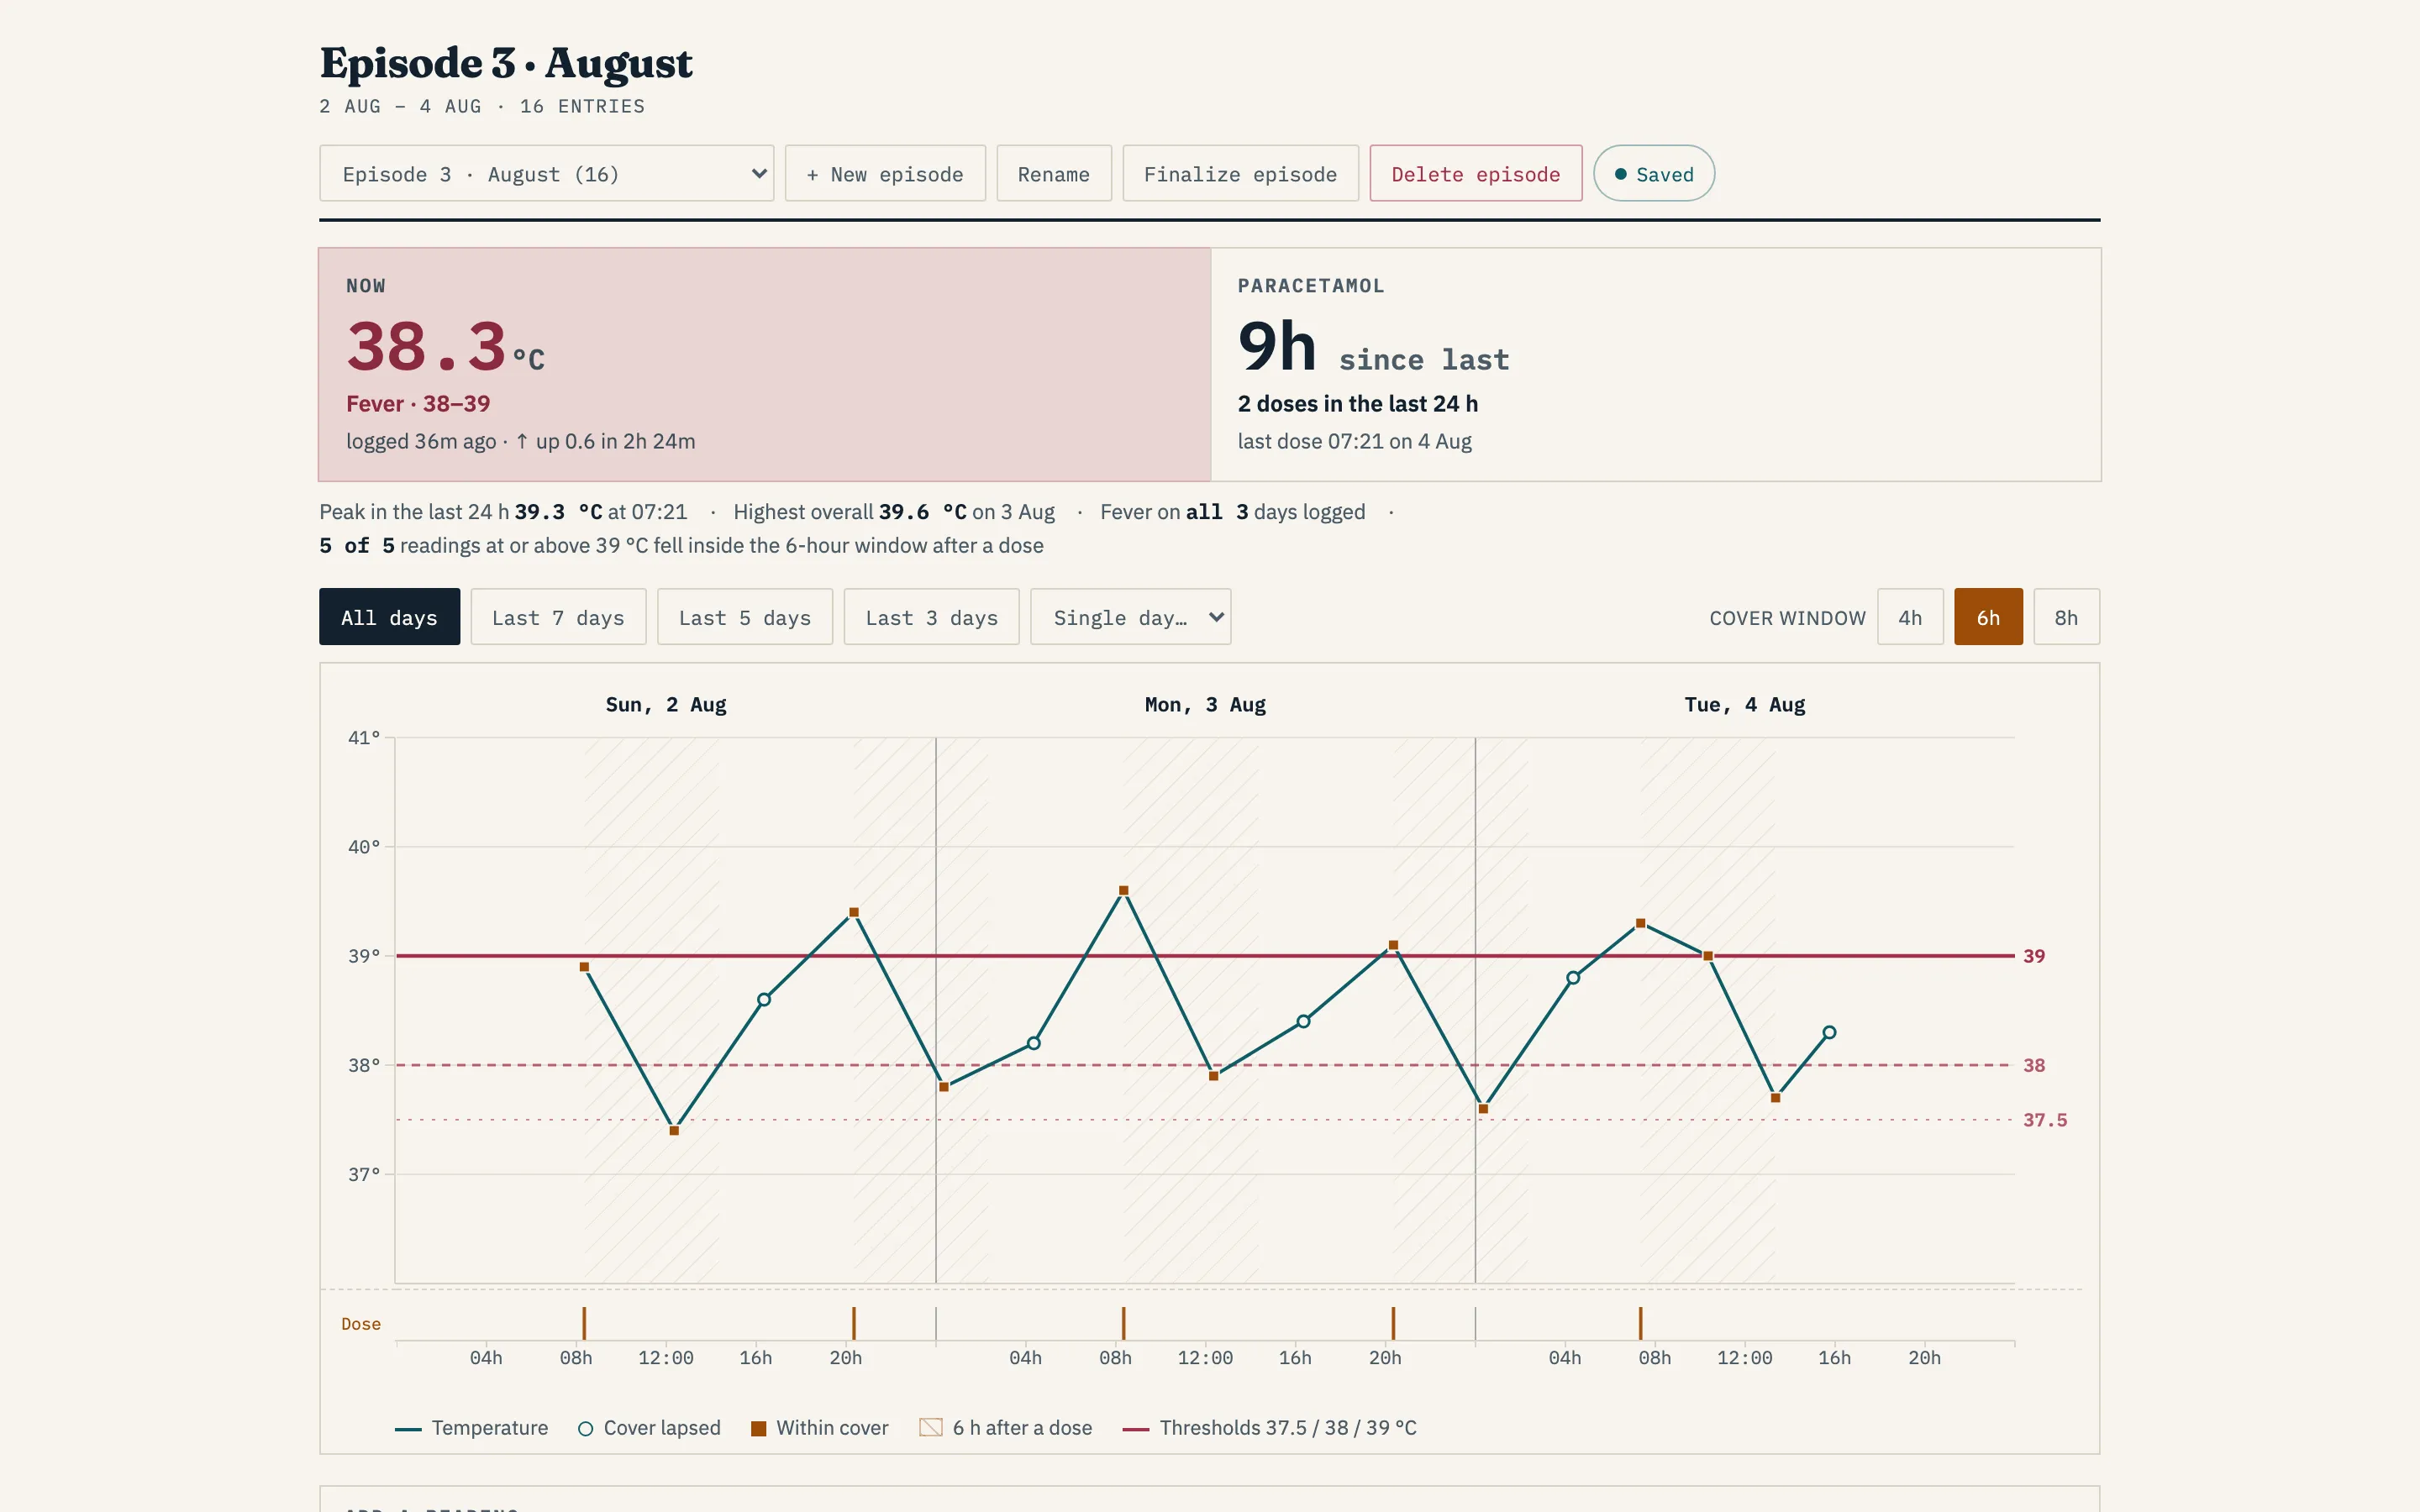
Body Temperature episode overview with the current reading, the paracetamol panel, and the episode chart, sample data
The current reading, the last dose, and the numbers behind both.

Fever against medicine, on one timeline

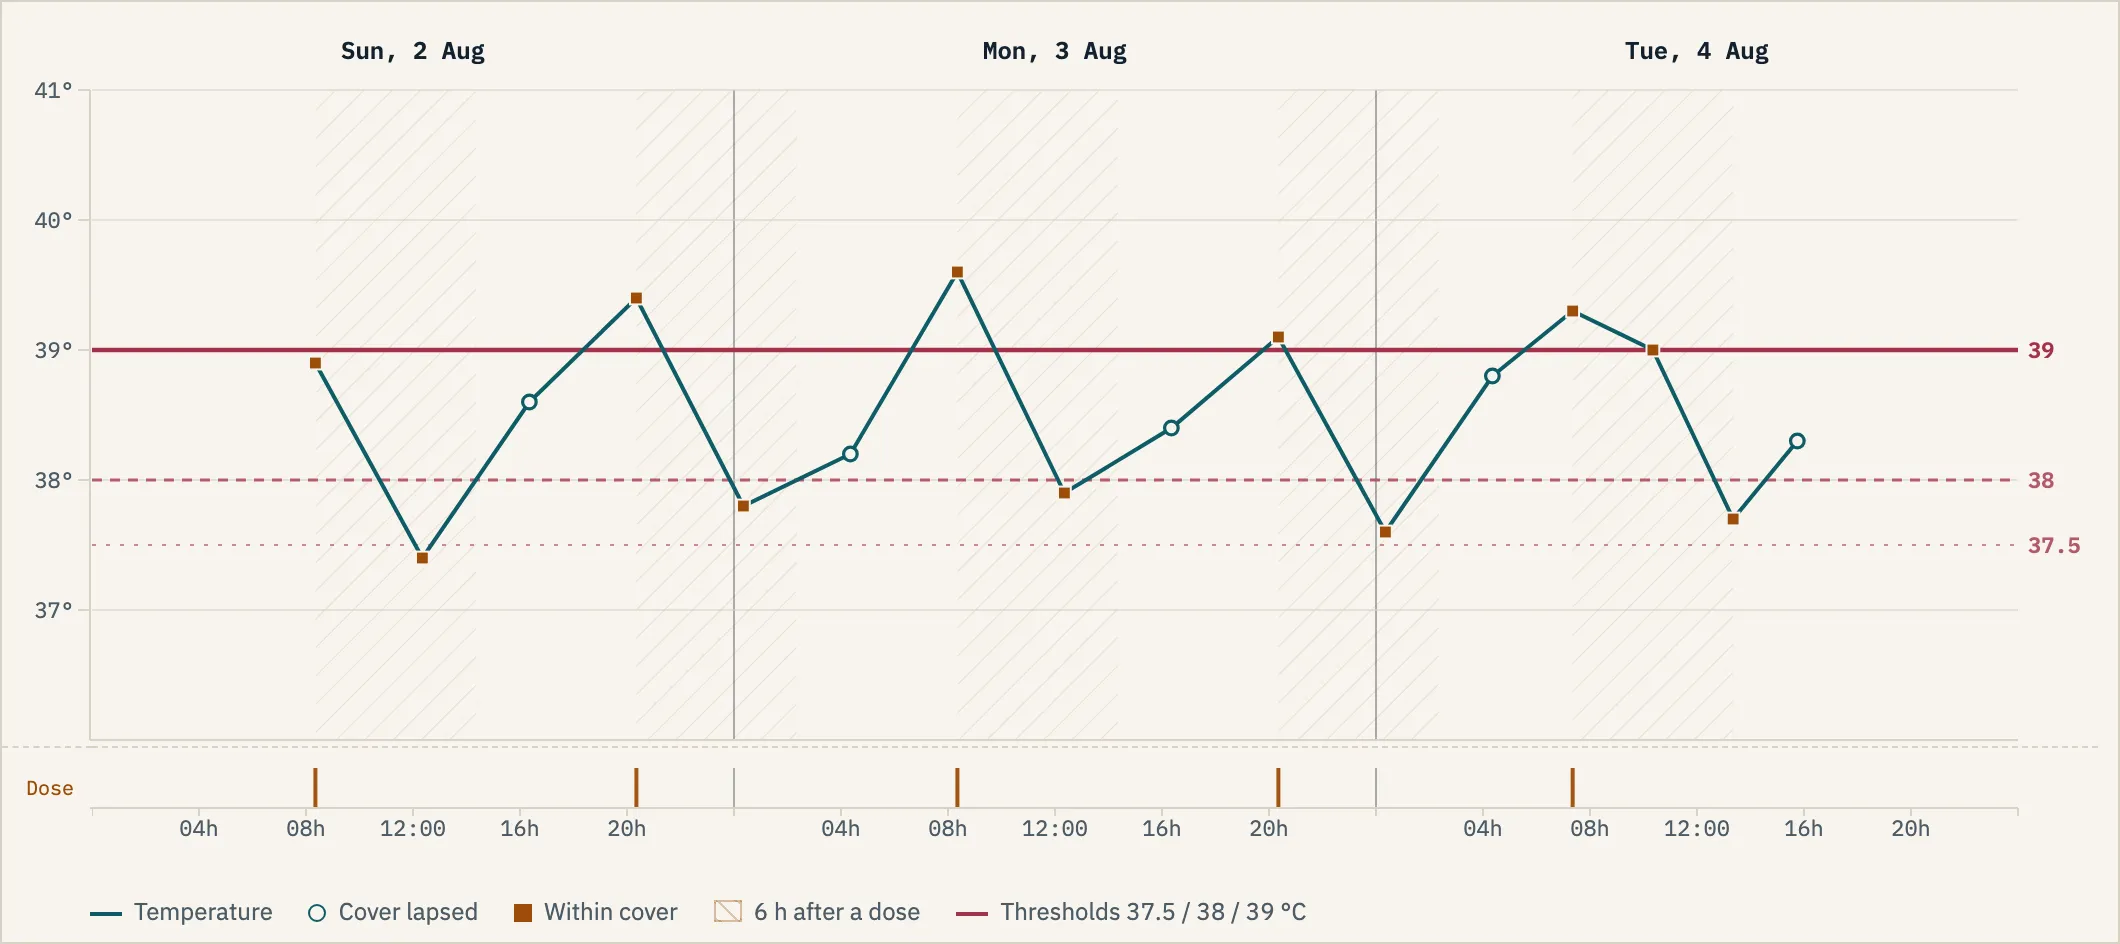
The chart puts both records on the same time axis: the temperature trace, and a rail of dose marks below it. The hatched span behind each dose is its cover window, four, six, or eight hours, whichever the person reading it wants to test. A spike inside a hatched span is a fever breaking through the medicine, which is the thing worth telling a doctor.

Nothing here relies on colour alone. The 37.5, 38 and 39 thresholds step up in stroke weight rather than in hue, because the tinted bands they replaced scored barely above 1.0 contrast against each other, with the ramp running backwards. Readings inside cover are squares and readings outside it are open circles. Segments are straight, not smoothed, because a curve drawn between a 40.3 at noon and a 37.1 at four swings through temperatures nobody measured.

Body Temperature chart with the temperature trace, threshold lines, hatched dose cover, and a dose rail, sample data
One time axis: the temperature, the thresholds, and every dose beneath it.

373 is not 37.3

A thermometer reads 37.3 and a tired thumb types 373. The obvious fix is to divide by ten and move on. This app refuses to, because silently storing a number nobody typed puts a guess in a medical record.

Instead it declines the entry, says what is wrong, and offers the correction as a button. The typed value stays in the field, so accepting the suggestion is one tap and correcting it by hand is one keystroke. The same 30 to 45 range is a check constraint in the database, so the rule holds even if the form is bypassed.

Body Temperature entry form rejecting 373 with a suggestion to use 37.3, sample data
The guard: refused, explained, and one tap from corrected.

The log, editable and honest

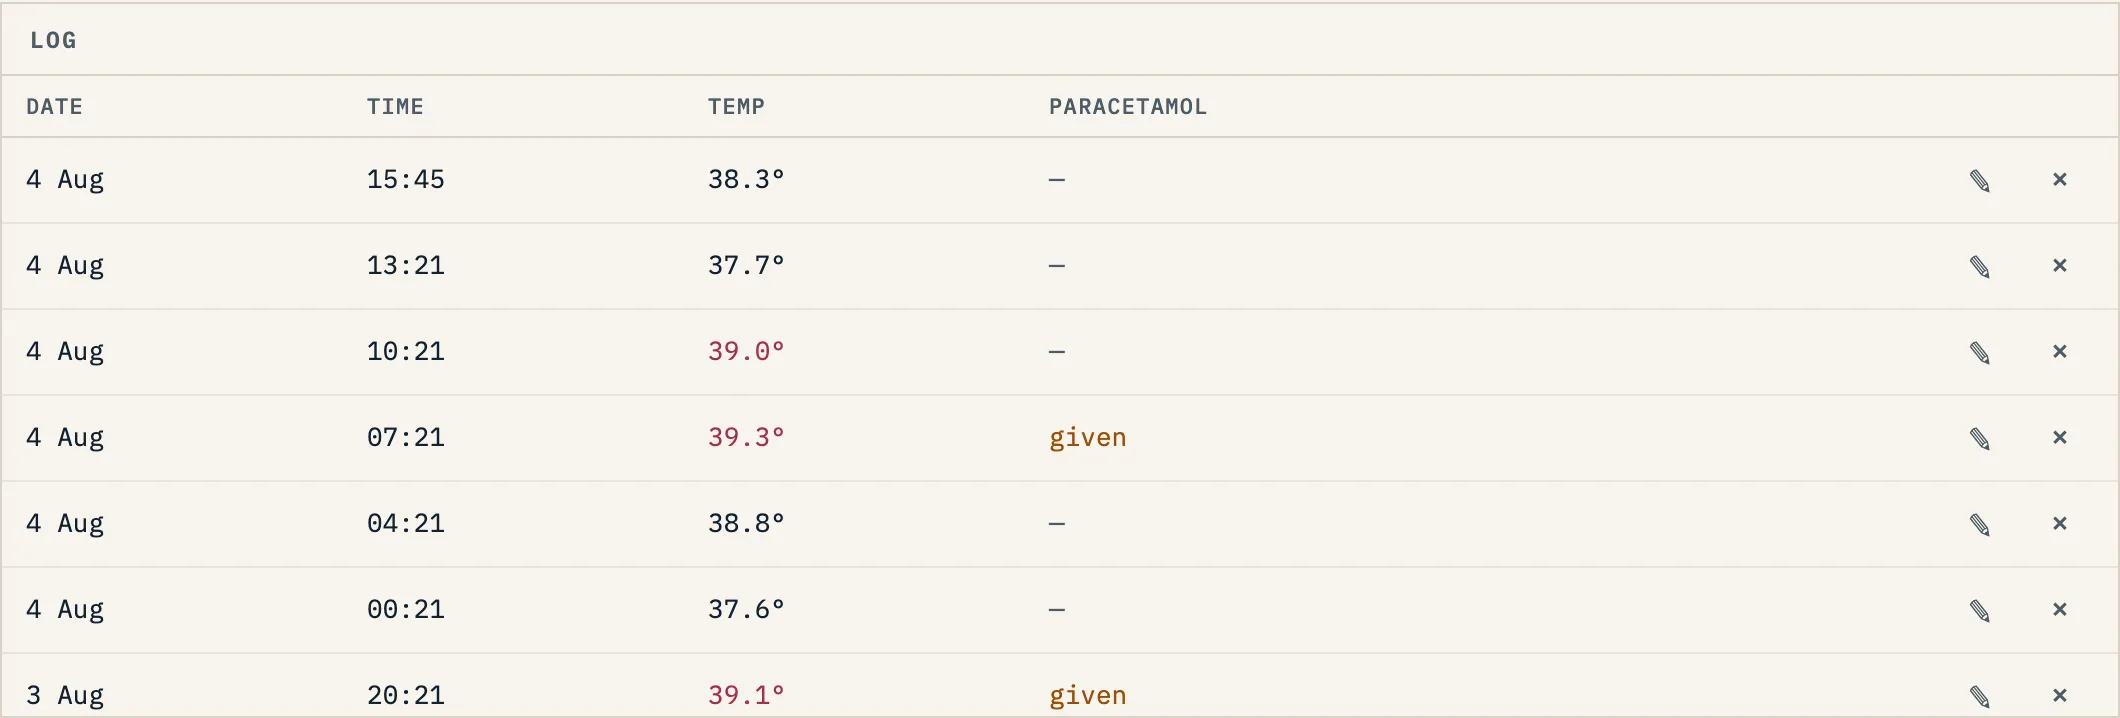
Every entry stays reachable in a plain table: date, time, temperature, whether a dose was given. Readings at or above 39 are marked. Editing an entry loads it back into the same form it was created in, so there is no second, subtly different edit screen to maintain.

Deleting confirms in the row itself. It used to be an instant, unguarded action on a twenty-pixel target sitting next to an identical edit button, which is exactly the kind of thing that deletes a night of readings at 3 a.m.

Body Temperature log table with date, time, temperature, dose column, and per-row edit and delete controls, sample data
The full log: every entry editable, deletion confirmed in place.

When it is over, close it

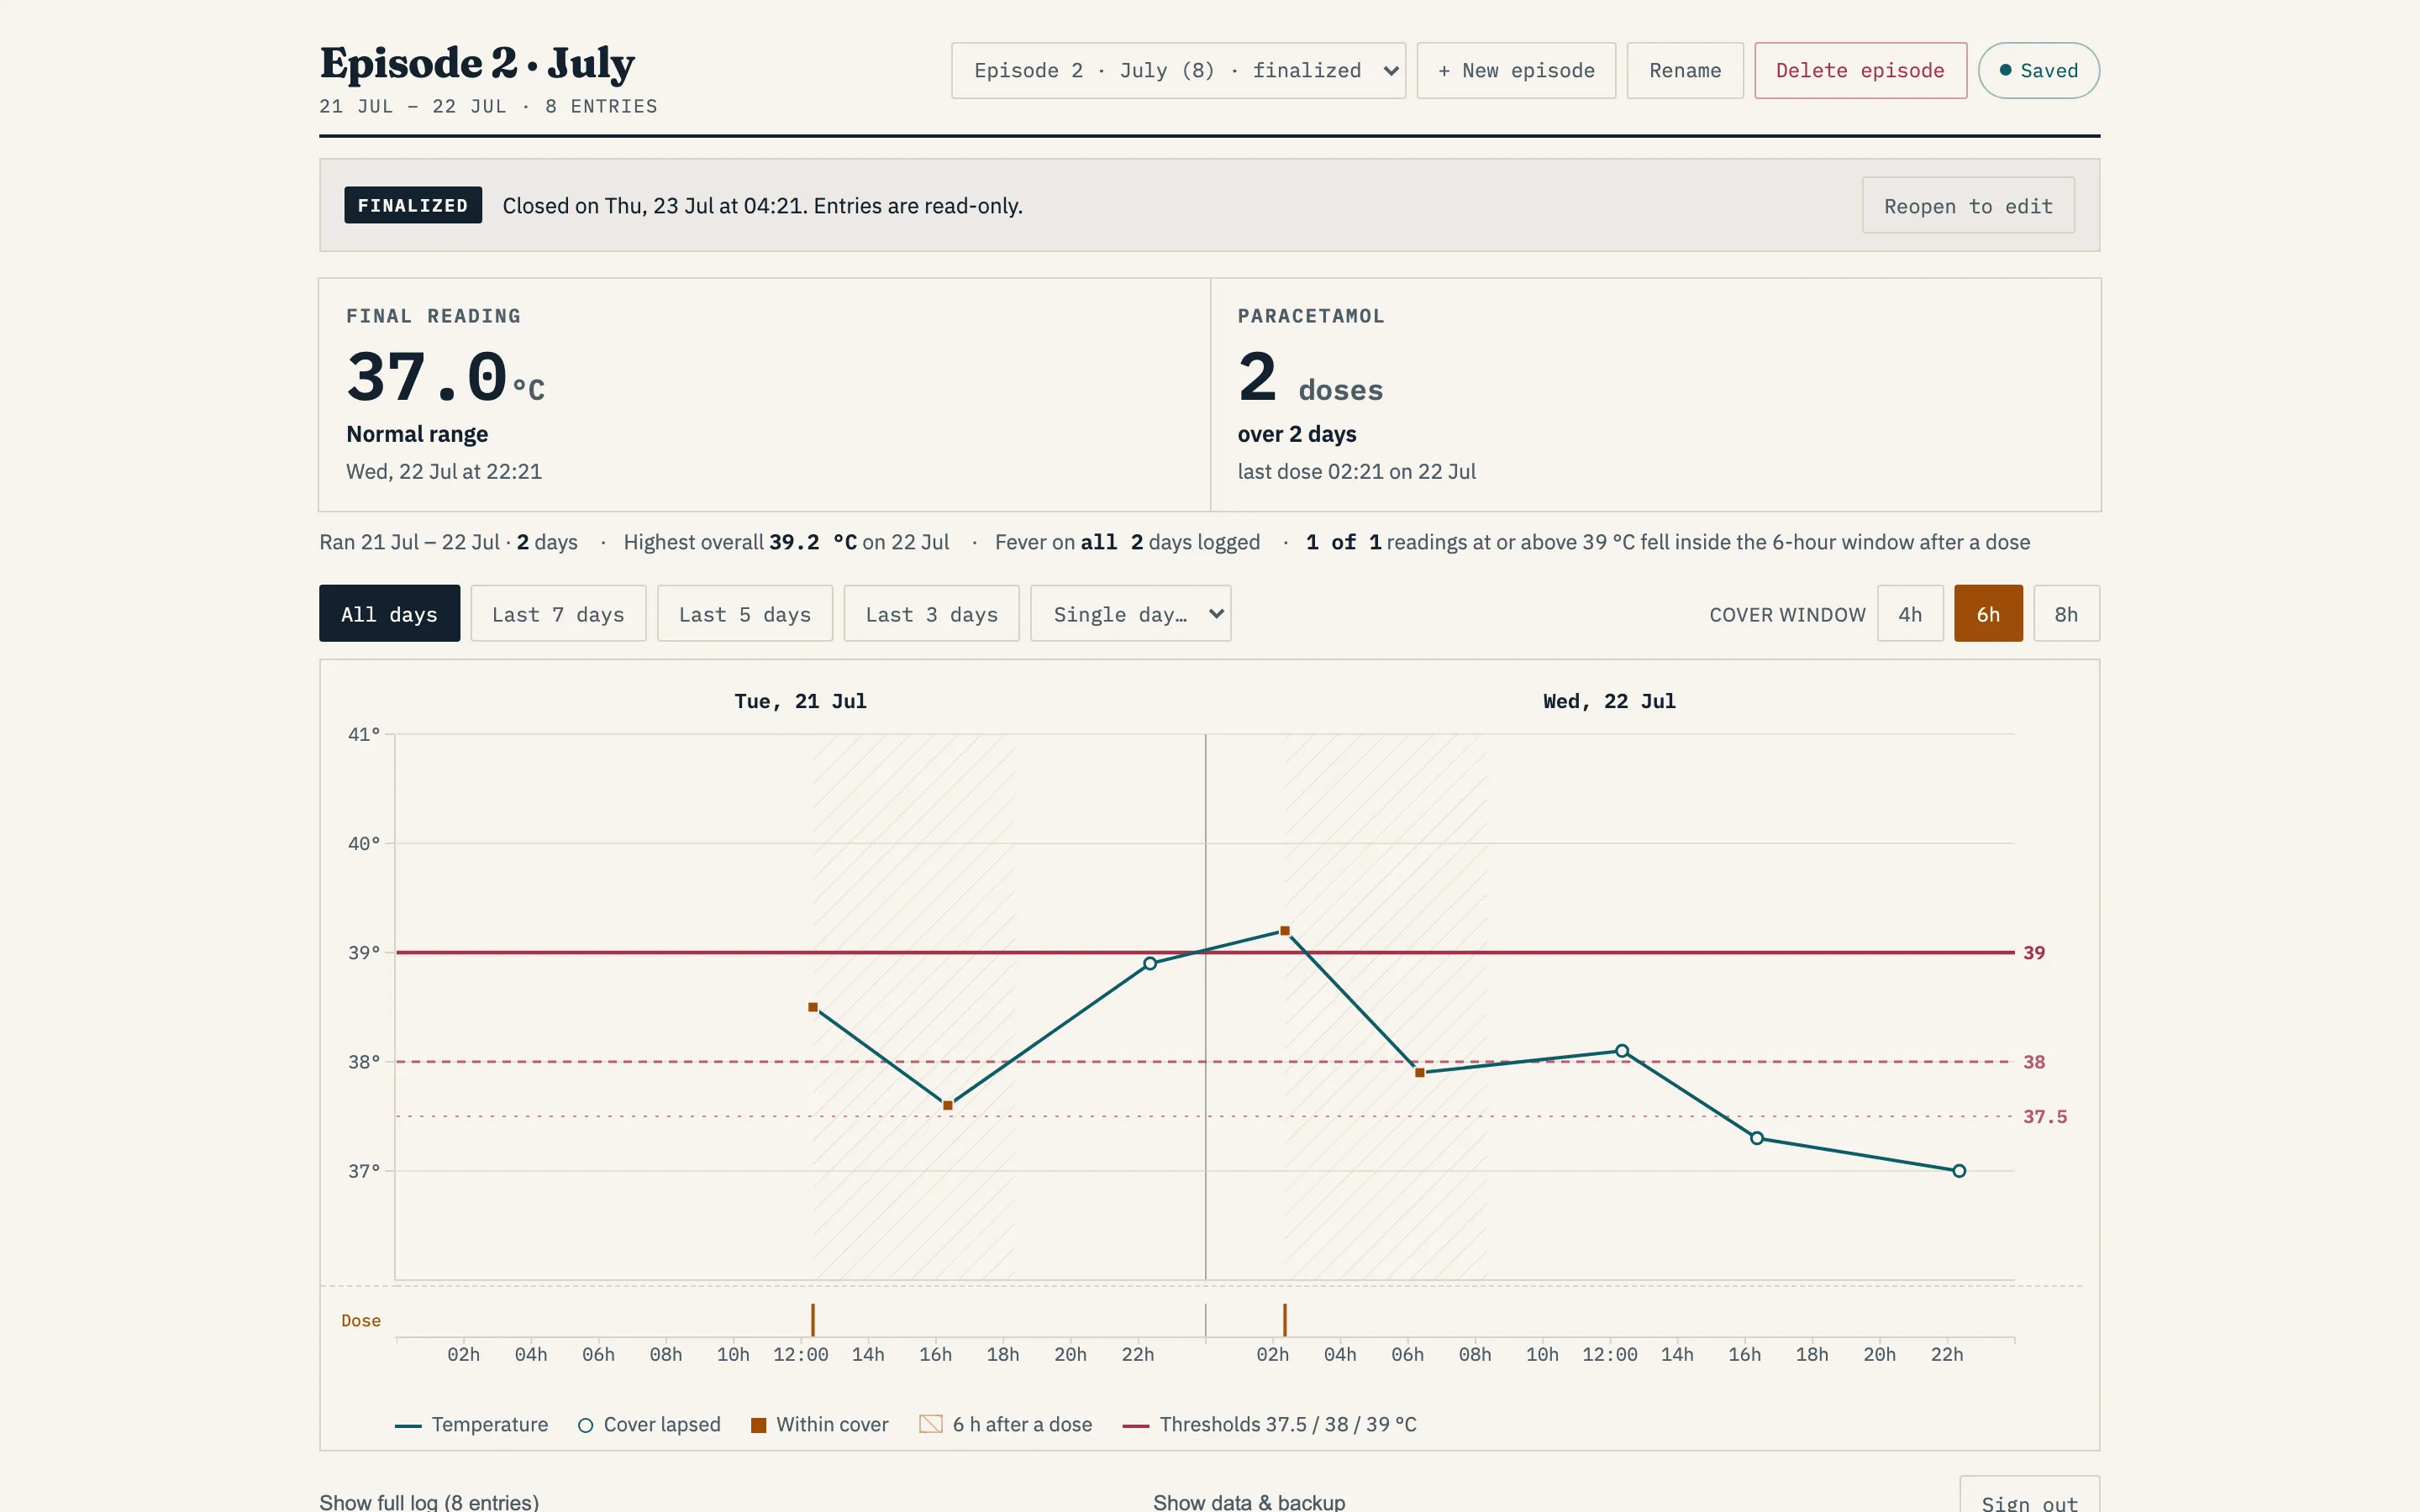
A finished fever becomes a finalized episode: read-only, with no way to add, edit, or delete until it is deliberately reopened. The screen changes tense with it. The hero stops saying "now" and starts saying "final reading", and the rolling 24-hour numbers give way to totals for the whole run, because a window measured against the present moment describes nothing about a settled record.

The add panel is not disabled, it is gone, and the bar that replaces it explains why and offers the way back. The real guard is a database trigger rather than the UI, but the routes check first so a refusal comes back as a sentence instead of a constraint error.

Body Temperature finalized episode showing the read-only bar, the final reading, and episode totals, sample data
A finalized episode: read-only, past tense, one button back.

Readable on the phone in your hand

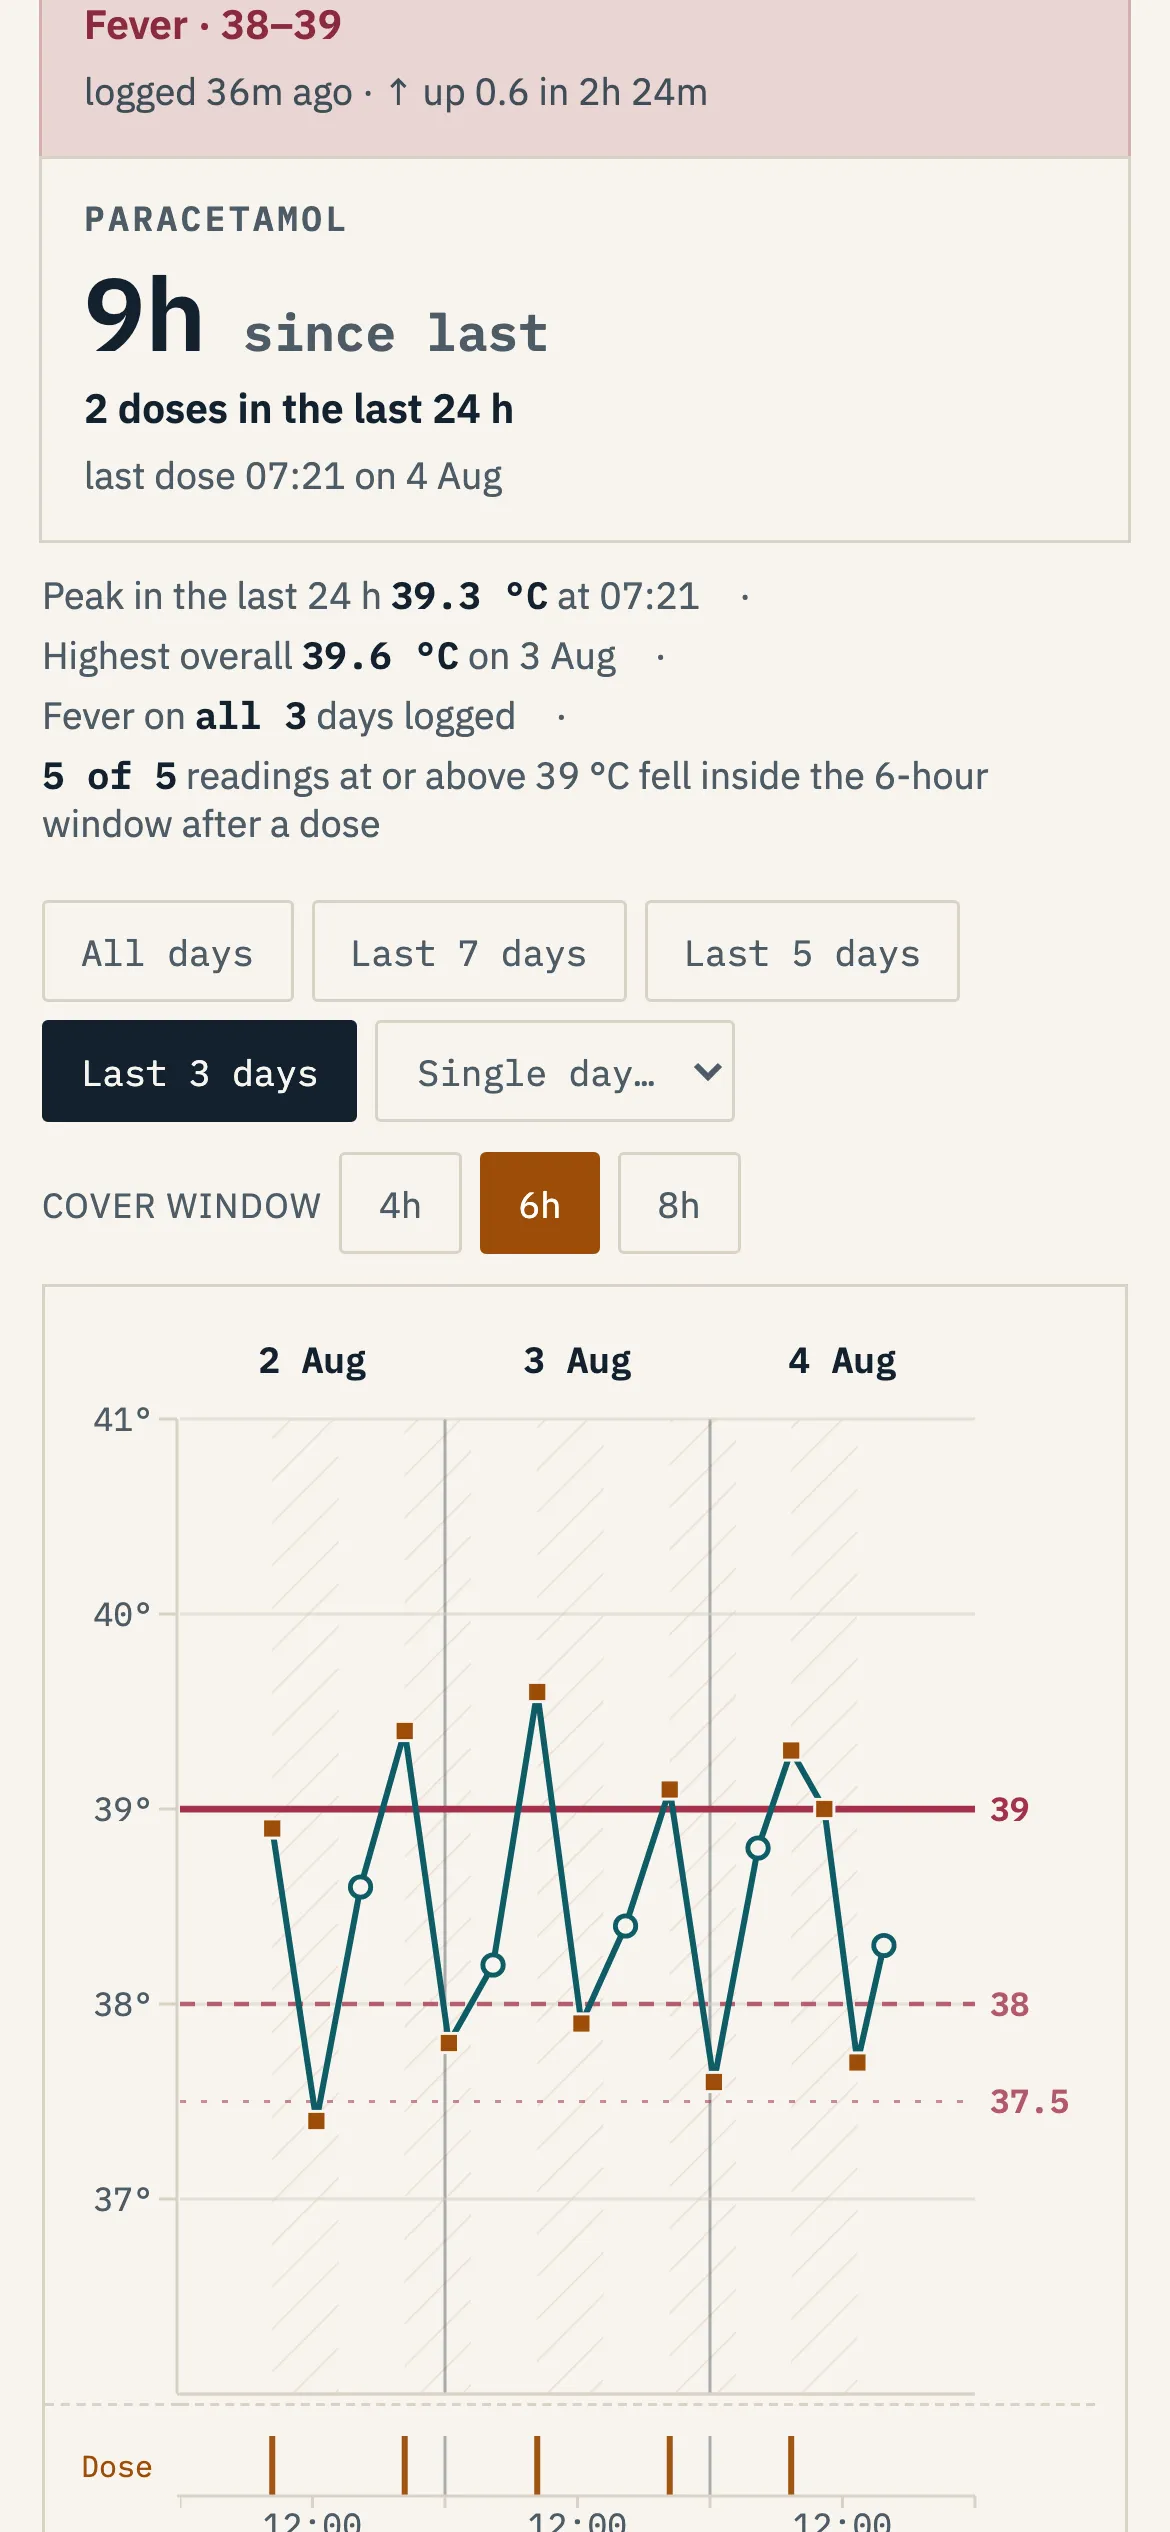
This gets read on a phone, in the dark, one-handed. Ten days of four-hourly readings squeezed into a 390 pixel screen left the marks overlapping each other, so the trace read as noise instead of as a temperature.

The chart no longer shrinks to fit. Density is fixed at a minimum width per day and the card pans sideways instead, opening at the most recent day, because a fever chart is read from now backwards. The axis and the dose labels stay frozen at the left edge while the plot scrolls under them.

Body Temperature on a phone, showing the panning chart with a frozen temperature axis, sample data
On a phone: fixed density, panned rather than crushed.

The hard parts

Never silently repair a number

The original spec asked for two contradictory things: keep the parser that rewrites 373 into 37.3, and reject 373 with a readable message. Rejection won. A tracker that quietly corrects input is a tracker whose history contains values nobody measured, and there is no way to tell later which entries were guessed at. The suggestion survives inside the error text, so nothing is lost but the guessing.

A window that ends now, not at the last entry

The doses-in-the-last-24-hours count was measured from the most recent entry rather than from the present moment. Log nothing for a day and it silently described a window that had already closed, on the one number where being current is the entire point. The wall clock is now state, ticked every thirty seconds and null until mount so the server and the first client render agree.

Times that cannot drift

Every displayed time is Asia/Jakarta regardless of the device, implemented as a fixed UTC+7 shift because Indonesia has observed no daylight saving since 1964. Timestamps are stored with their offset and rendered by Postgres rather than parsed into a JavaScript Date, so no driver and no traveling phone can move a reading to a different hour of the night.

Notes on the build

Next.js App Router on Vercel with Neon Postgres over its HTTP driver, behind one shared passphrase exchanged for a signed, httpOnly session cookie. Writes are optimistic and roll back on failure, so logging a reading feels instant on a bad connection and nothing typed is lost when it fails. The rules that matter are constraints and a trigger in the database, not just checks in the form, and the routes translate each of them into a sentence a person can act on rather than a 500.

If you want to talk about this build, or something you want built, say hello on WhatsApp or write to philip.kamdani@gmail.com.

Back to the work